Can we predict El Niño? Moreover can we calculate it’s severity and effects on different parts of the world? On board the research ship Ka’imimoana scientists carry out measurements and then build computer models to understand the climate cycle that produces El Niño.
The documentary “Chasing El Niño” was released by the aftermath of an intense El Niño event observed during 1997/1998 measured. In March 2015 climatologists have started to detect early signs of another one beginning to develop. They are now bracing to observe it. Peru has been the location where the first signs of the cycle become noticeable especially by the fishermen who suffer first from its consequences.
The Tropical Atmosphere Ocean (TAO) array was deployed in 1984 as a network of buoys that measure surface winds, surface temperature, upper ocean temperature and ocean currents by NOAA. Scientists ability to predict the ’82-’83 El Niño was hampered by a volcanic eruption. Satellites were obscured and falsely the sea surface temperatures were measured lower by a few degrees. The TAO array played a major role for scientists forecast the on-coming of the ’97-’98 El Niño.
Since this documentary was produced a lot has been learned. El Niño also appears to suppress the formation of hurricanes over the Atlantic Ocean by moving the jetstream towards south. The position of jetstream coincides with the main development region of Atlantic hurricanes and prevents hurricanes to increase their intensities. Scientists also began to pay more attention to Kelvin waves that are formed as ocean’s response to winds. Kelvin waves move along the equator and are forced to travel west-to-east — a result of Coriolis forces created by Earth’s rotation. As the waves travel towards South America they depress the thermocline. These waves take about three months to cross the Pacific from west to east.
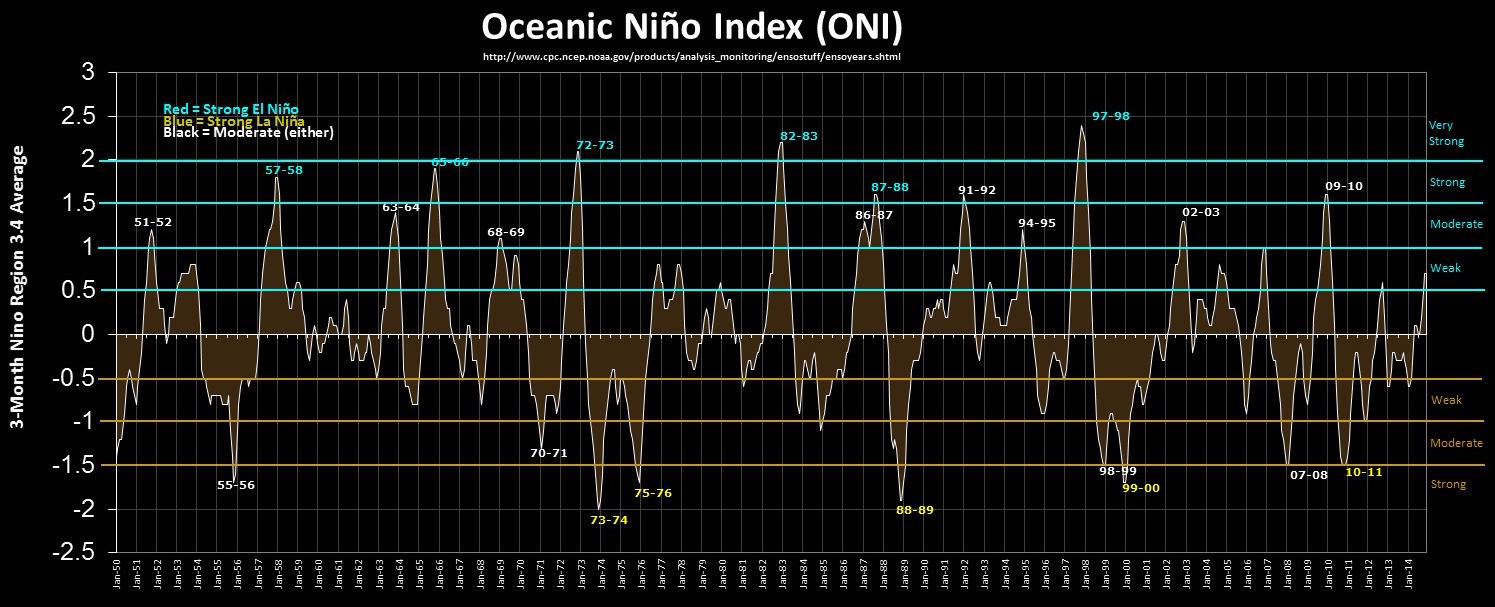
Computer models continued to improve. European Center for Medium-range Weather Forecast ECMWF is one of them. ECMWF successfully forecasted Hurricane Sandy of 2012. These computer models combine many different measurements. At NOAA, the official ENSO indicator is the Oceanic Niño Index (ONI) (see the graph below):
How is El Niño related to the Southern Oscillation (ENSO)? El Niño is an oceanic phenomenon, while the Southern Oscillation is an atmospheric phenomenon. Below is a time-lapse representation of ENSO events recorded in 1998 and 2010 comparing sea surface temperature (SST) anomalies of the two events. A split screen showing SST and seas surface height anomaly simultaneously during the aftermath (2011-2012) is included in the end.
El Niño Events of 1998 and 2010 from Nature Documentaries on Vimeo.


2 Comments