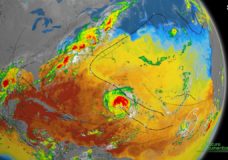
A Scientific Visualization of the 2020 Atlantic Hurricane Season – NASA/SVS (2020)
NASA’s Scientific Visualization Studio (SVS) has released an animated summary of the 2020 Atlantic hurricane season. The visualization starts on May 1, 2020 showing Sea Surface Temperatures and cloud cover. Precipitation data layer enters in as hurricanes are tracked throughout 2020. Hurricane strengths pepresented with the letter “T” for Tropical Storm and numbers for each storm’s respective strength along the hurricane tracks. At the end by all storm tracks are projected together on the surface. The season stunned meteorologists and […]


Recent Comments