The cryosphere covers parts of the Earth’s surface where water is found in the form of snow, sea ice, glaciers, permafrost, ice sheets, and icebergs. Ice and snow exist close to their melting point. Fluctuations in surface temperatures of our planet leads to frequent state changes in water from solid to liquid and back. Using satellite observations scientists monitor such changes in the global and regional climate. The Earth’s cryosphere shrink and expand on a yearly basis.
The animation begins in Antarctica, showing some prominent features of the Antarctic landscape. Ice shelves, ice streams, glaciers, and the formation of massive icebergs can be seen clearly in the Landsat Image Mosaic of Antarctica. The movement of Iceberg B15, an iceberg 295 kilometers in length which broke off of the Ross Ice Shelf in 2000 is quite curious. Iceberg B15 was the largest iceberg ever observed. Moving farther along the coastline, a time series of the Larsen ice shelf shows the collapse of over 3,200 square kilometers ice since January 2002. The apparent area of the Antarctic doubles during the southern hemispheric winter.
From Antarctica, the animation travels over South America showing glacier locations on this largely tropical continent. In further north the daily changes in snow cover over the North American continent can be seen. The clouds show winter storms moving across the United States and Canada, leaving trails of snow cover behind. In a detailed view of the western US, the difference in land cover between two years is compared. In 2003 the region received a normal amount of snow. In contrast, the year 2002 had very little snow accumulation. The difference in the surrounding vegetation due to the lack of spring melt water from the mountain snow pack is evident.
As the visualization moves from the western US to the Arctic region, the areas affected by permafrost are visible. As time marches forward from March to September, the daily snow and sea ice recede and reveal the vast areas of permafrost surrounding the Arctic Ocean.
The animation shows a one-year cycle of Arctic sea ice followed by the mean September minimum sea ice for each year from 1979 through 2008. The superimposed graph of the area of Arctic sea ice at this minimum clearly shows the dramatic decrease in Arctic sea ice over the last few years. An updated version of the Arctic sea ice dynamics reflecting weekly changes from 1984 to 2016 has been produced by the NASA SVS.
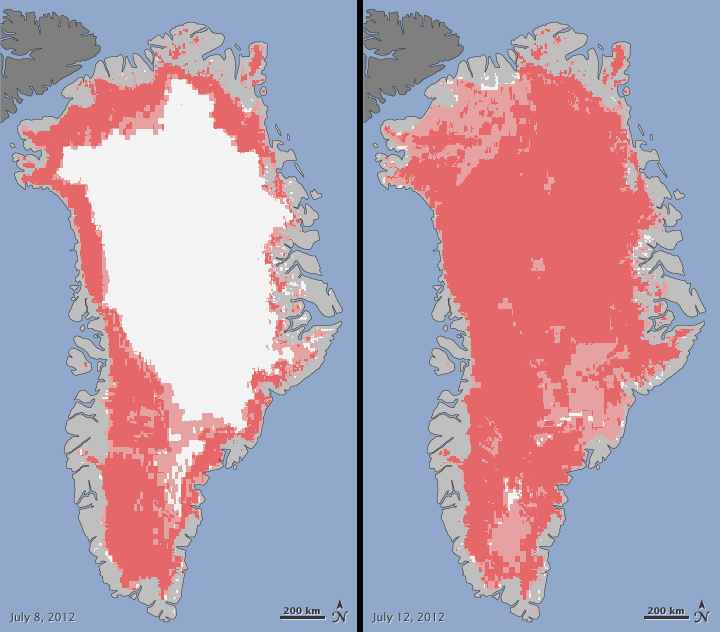
While moving from the Arctic to Greenland, the animation shows the constant motion of the Arctic polar ice using daily measures of sea ice activity. Sea ice flows from the Arctic into Baffin Bay as the seasonal ice expands southward. As we draw close to the Greenland coast, the animation shows the recent changes in the Jakobshavn glacier. Although Jakobshavn receded only slightly from 1964 to 2001, the animation shows significant recession from 2001 through 2009. As the animation pulls out from Jakobshavn, the effect of the increased flow rate of Greenland costal glaciers is shown by the thinning ice shelf regions near the Greenland coast. One of the largest calving events has been documented in Greenland by makers of the documentary Chasing Ice. A sudden melt observed in Greenland during July 2012 alarmed scientists. On July 12th 2012, close to 97 percent of Greenland’s ice began to melt:


1 Comment