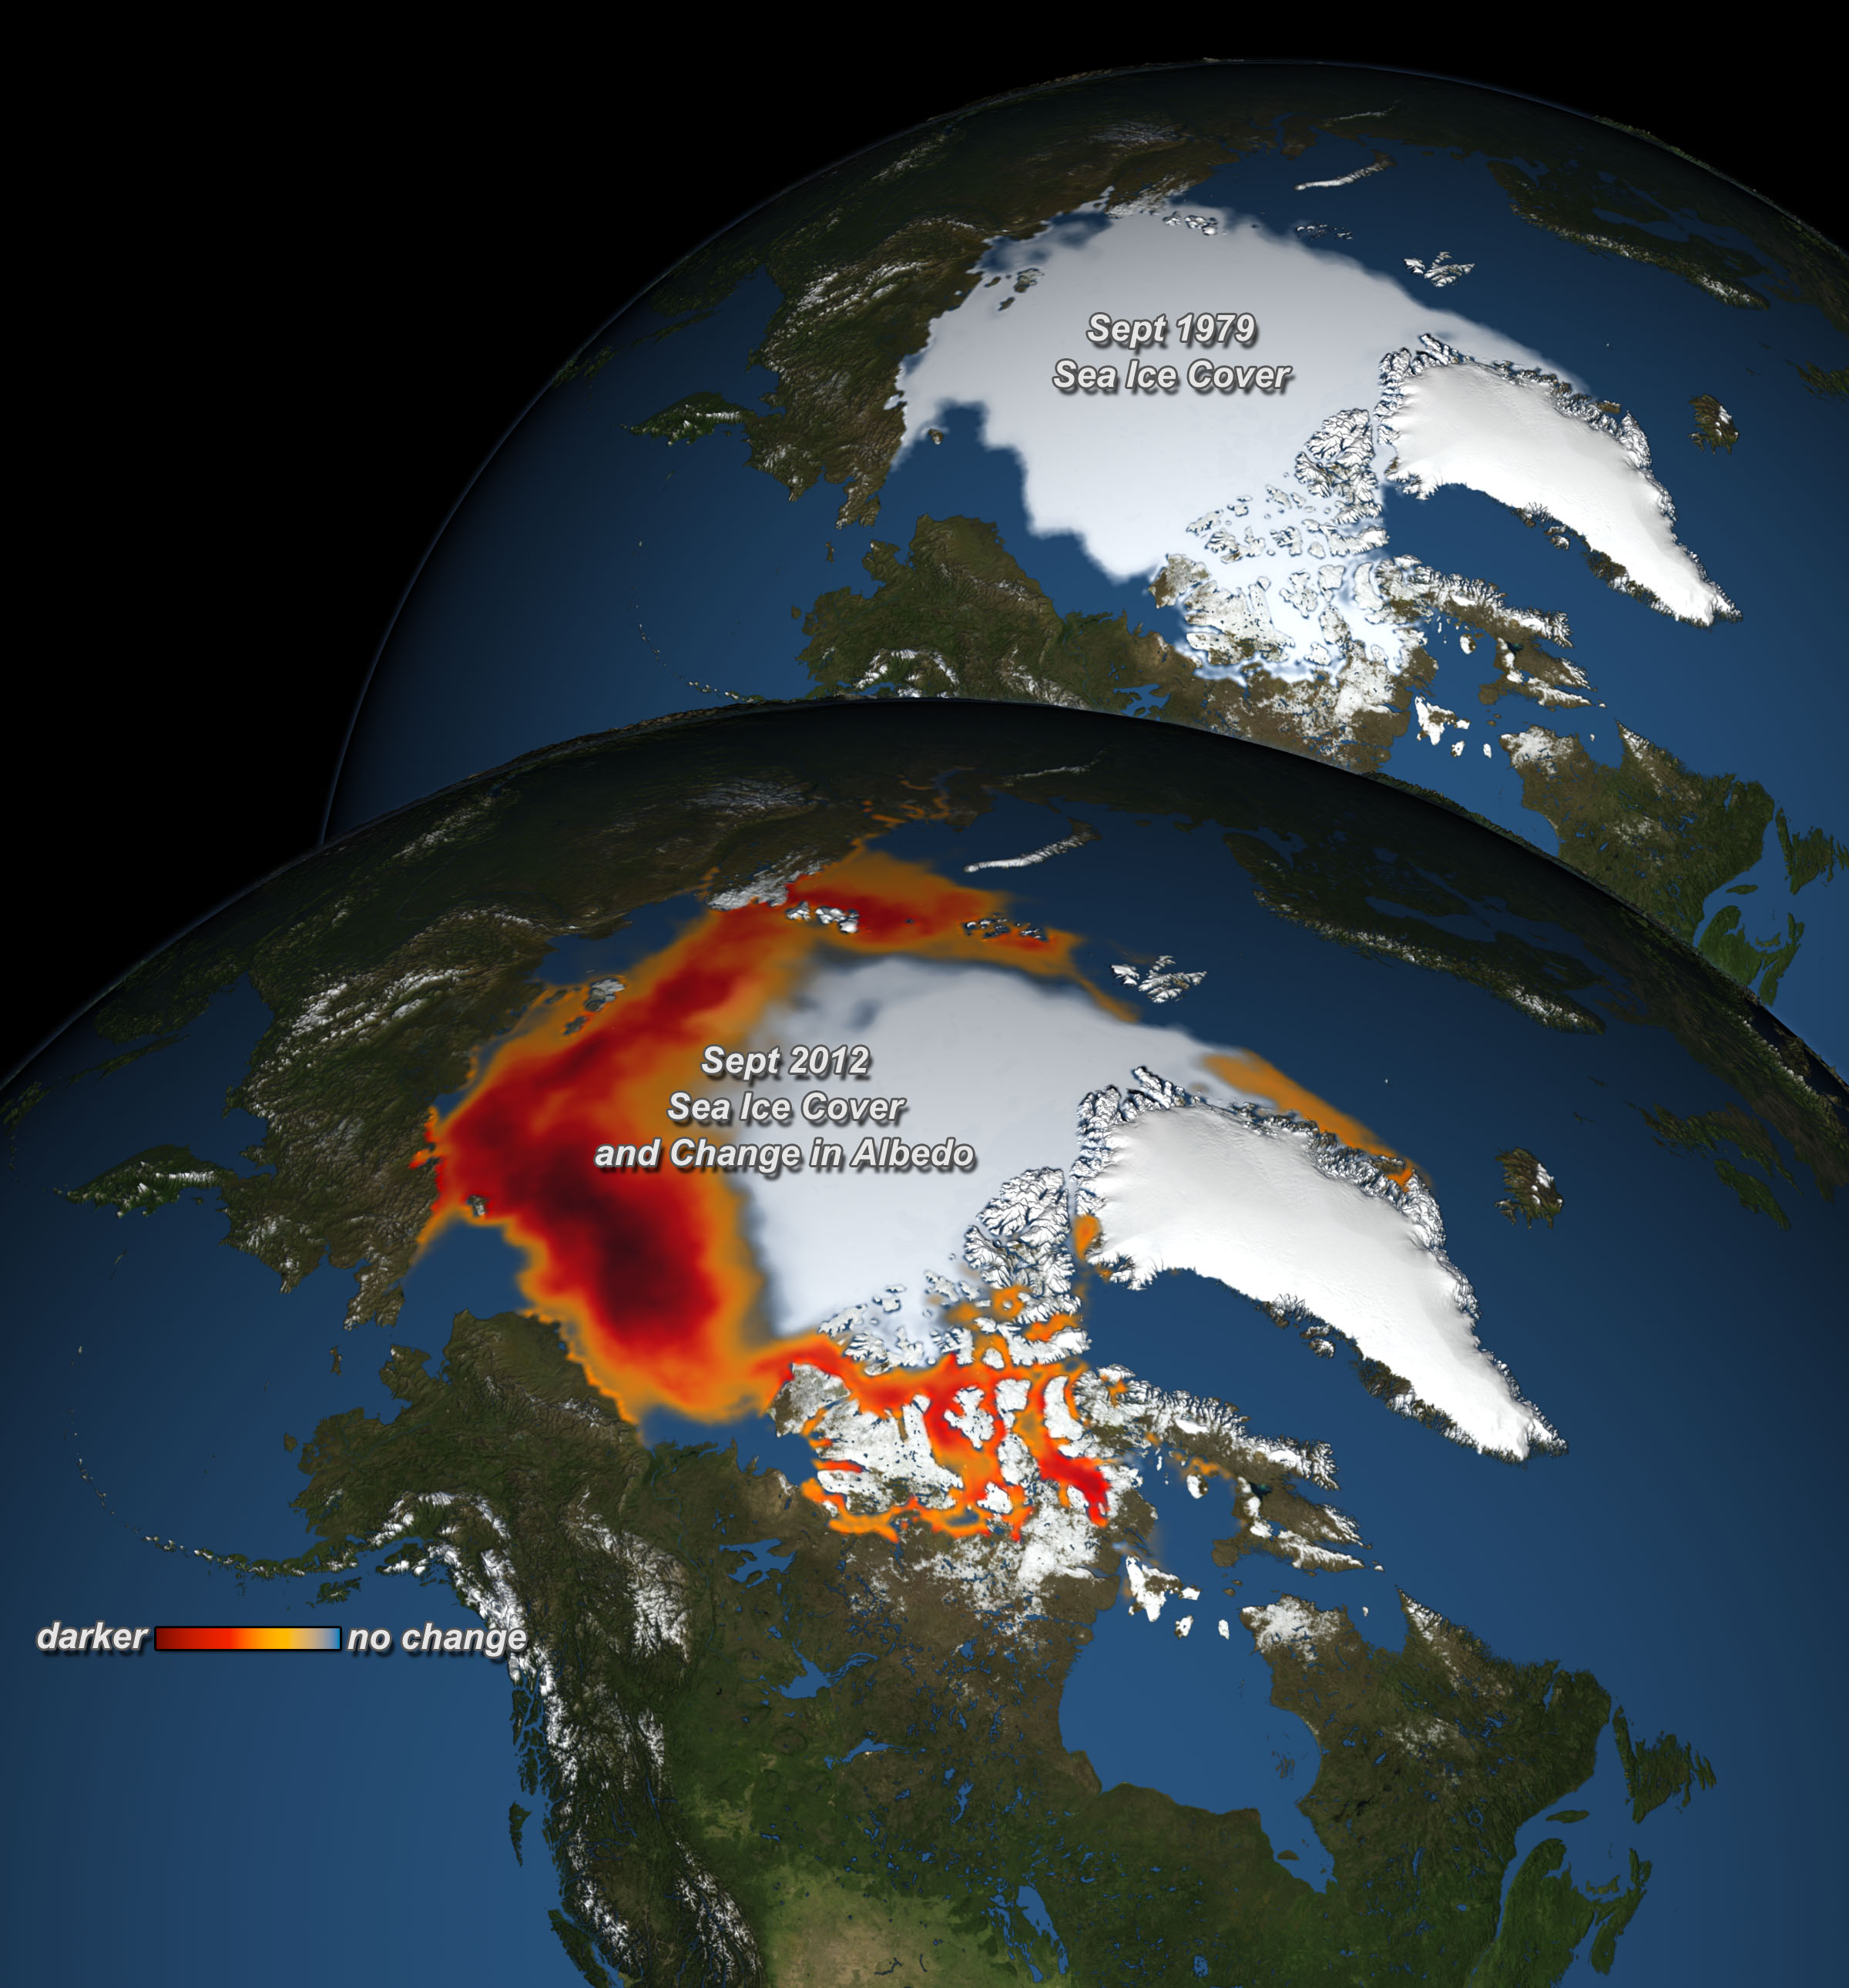
NASA’s Scientific Visualization Studio (SVS) has produced an animation showing the sea ice dynamics in the Arctic. The diminishing ratio of multi-year sea ice is staggering. Human contribution to global warming is well documented. The response of the polar regions to heating especially in the Arctic is extremely fast. While scientists are rushing to predict future temperature and precipitation using exceedingly complex climate models, the behavior of the cryosphere is a curious one. We are already witnessing rather large glacial calving events and mass balance of glaciers are changing negatively.
One significant change in the Arctic region in recent years has been the rapid decline in multi-year sea ice that does not melt over the summers. Perennial ice may have a life-span of nine years or more. Its thickness can grow up to four meters thick. The Russian and American navies have been measuring the thickness of the sea ice for a very long time. Knowledge of ice thickness was crucial for nuclear submarines. In the past submarines’ ability to surface was significantly restricted due to widespread perennial sea ice that was too thick. Presently, the thickness of the first year ice that grows during a single winter does not exceed two meters posing no limitations to submarines. In fact the historically closed northeast sea passage is now navigable by cargo ships unassisted by ice breakers.
Through most of 2016, the Arctic region temperatures were above the long term average by up to 6 degrees Celsius. The Arctic is warming twice as fast as the global average. The loss of sea ice is influencing weather, climate and ocean circulation patterns in other parts of the globe. Perhaps the most drastic and immediate influence comes from the reduction in albedo. Loss of sea ice means loss of reflective surface. Conversion of white ice into light absorbing dark ocean waters contributes to many feedbacks speeding the climatic changes. Change in albedo can take many forms including natural and artificial aerosols, cloud cover and even forest type is one of the major affecting the incoming solar energy budget of the planet.
The animation by NASA’s Scientific Visualization Studio (SVS) shows how sea ice grows in the Arctic winter and melts in the summer. The animation also shows the annual changes, depicting the age of the sea ice in different colors. Younger sea ice, or first-year ice, is shown in a dark shade of blue while the ice that is four years old or older is shown as white. A color scale identifies the age of the intermediate years.
A graph in the lower, right corner quantifies the change over time by showing the area in millions of square kilometers covered by each age category of multi-year sea ice. This graph also includes a memory bar – the green line represents the current maximum value seen thus far in the animation for the particular week displayed. For example, when showing the first week in September, the memory bar will show the maximum value seen for all prior years’ first week of September since the beginning of the animation (January 1, 1984).
A graph in the lower, left corner quantifies the change over time by showing each age category of sea ice as a percent of total ice cover in the Arctic Ocean. The lavender outline on the map indicates the spatial region covered by the Arctic Ocean and thus included in the graph.
In 2019, German research vessel RV Polarstern will spend a year in the Arctic drifting in an ice-locked state to study North Pole.
Science Bulletins: Declining Sea Ice Affects Caribou from AMNH on Vimeo.


0 Comments
You can be the first one to leave a comment.